Gantt Chart
I want to plan a project...
by developing a project schedule
LEVEL OF INVOLVEMENT: COMPLEX TOOL
This tool outlines all project activities in an organized manner and enables you to efficiently manage your projects timeline.
This tool outlines all project activities in an organized manner and enables you to efficiently manage your projects timeline.
Plan a project by developing a project schedule
WHAT is it?
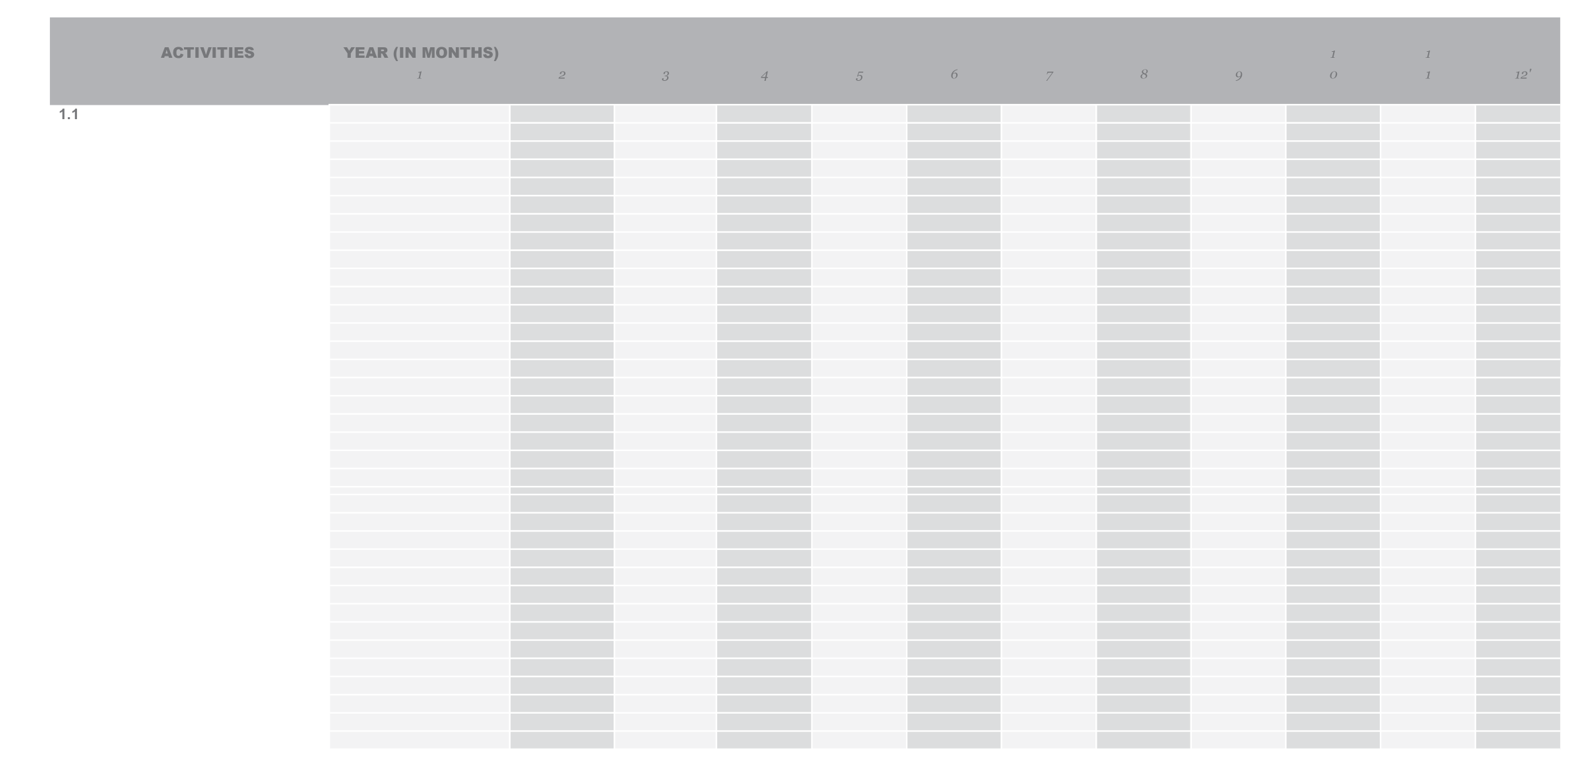
The Gantt Chart graphically represents your project timeline from start to end. It’s easy to prepare and a useful way to look at the relationships between different project elements.
Your Gantt Chart is the document that you use to make sure that project activities are on track! Once you have logged the timeline for each of your project deliverables, the software will allow you to roll each of these up into one timeline reflecting the whole project. The deliverable that takes the longest time to complete – or has the longest sequence of activities – is your critical path!
Your Gantt Chart is the document that you use to make sure that project activities are on track! Once you have logged the timeline for each of your project deliverables, the software will allow you to roll each of these up into one timeline reflecting the whole project. The deliverable that takes the longest time to complete – or has the longest sequence of activities – is your critical path!
HOW do I use it?
Teamwork: Preparing your Gantt Chart is something that you should do with your project team(s). It’s worth completing a Gantt Chart for each of your project deliverables, breaking each of them down into their component activities.
The UNITAS team used a Gantt Chart to prepare a timeline for their sanitation awareness program. They began by listing all of the activities related to the campaign in a left hand column. Across the top of the chart, they outlined the timeframe within which the campaign needed to take place. For each of the different tasks, they shaded in the cells on the Gantt chart corresponding to the dates required for each activity.
Monitoring tool: It is important to revisit your Gantt Chart regularly. This will enable you to spot variations, amend deadlines, or re-scope the project if needed. If your delivery deadline and project scope are fixed, it may still be possible to keep a project on track by fast-tracking some elements, so as to bring the overall project back in line with its critical path. You may be able to add additional resources to accelerate progress, but there may also be cost implications in doing so.
Leadership: Your Gantt Chart is a living document, to be updated and shared others to ensure that all are informed about progress. This gives your team and those close to the project confidence that your project is being overseen and managed effectively.
The more detailed charts are great for operational planning, implementation and monitoring of activities – and are of greatest interest to the project team, partners and suppliers responsible for completing project work, packages and tasks. A high-level or summary Gantt Chart is a useful, high-quality and professional tool for board meetings or higher-level communications.
WHEN do I use it?
You complete your Gantt Chart with your team(s) before you start to implement your project, revisiting it throughout to keep track of progress. Updating and sharing your Gantt charts is also a professional way to share project progress with donors or your leadership team.
Who is involved?
The Gantt Chart is something that you develop, and that you share with your team, line managers, and other stakeholders involved in the project as required.
Tips:
The format of the Gantt Chart makes it easy to spot and address issues that could have impact on the project’s critical path.
Additional Resources
Download the additional resources and the Project DPro (PMD Pro) Pocket Guide
Supported & Developed by:


Shared by:


Users are free to copy/redistribute and adapt/transform
for non-commercial purposes.
© 2022 All rights reserved.